The AI That Helps Voters Compare Candidate Positions — And Helps Journalists Understand What Their Communities Actually Care About
WhoDoIVoteFor is a free, nonpartisan civic information platform for every Los Angeles resident ahead of the June 2, 2026 California Primary. It compiles publicly available candidate position information and presents it in an accessible, easy-to-understand format — similar to Ballotpedia, personalized to your specific issues.
For voters, it takes two minutes. For journalists and media organizations, it provides structured civic data about community concerns — compiled from publicly available sources for educational purposes only.
May 2026 · 12 min read · whodoidvotefor.com
What Is WhoDoIVoteFor?
Most voter guides are built around candidates. They list who's running, what party they belong to, and link to a Ballotpedia page. They're useful the same way a phone book is useful — comprehensive, but impersonal, built for no one in particular.
WhoDoIVoteFor works differently. It starts with the voter — their neighborhood, their concerns, the issues they care about — and uses AI to compare their priorities against publicly available candidate positions. Every race on their ballot. Informational. In under two minutes.
For the voter, that's the product. But underneath that simple experience is something more significant: every completed quiz generates a structured civic data point — ZIP code, weighted concerns, and demographic profile, all linked together by a session ID. As thousands of people use the tool, a detailed picture emerges of what different neighborhoods, age groups, and communities actually care about in this election.
That picture — queryable, filterable, updated in real time — is what makes WhoDoIVoteFor valuable to media organizations, journalists, and civic researchers. You don't just see that housing is a concern. You see that housing is a top concern for residents in ZIP 90006, while wildfire response ranks highest in hillside neighborhoods that lived through the January fires.
1,000+
Submissions
760
With Demographics
754
Fully Linked
58
ZIP Codes
"A voter who uses WhoDoIVoteFor isn't answering a pollster's question. They're telling you what they care about, how much they care about it, and doing so from a specific ZIP code — because they want something useful in return. That behavioral context is what traditional polling cannot buy."
Part One: The Voter Experience
🗳️ For Voters — Free, Nonpartisan, 2 Minutes
The public-facing side of WhoDoIVoteFor is designed to be as fast and friction-free as possible. No account, no party affiliation, no ads. Enter a ZIP code, select the issues that matter to you, rate their importance, and receive a civic information summary covering every race on your ballot.
The Homepage — One Question, One Field
The experience begins with a single ZIP code input. The badge — "Nonpartisan · AI-powered · California" — sets expectations immediately. This isn't a campaign site. It works for any Los Angeles County ZIP code, covering every race on the June 2 primary ballot, from Governor down to school board and ballot measures.
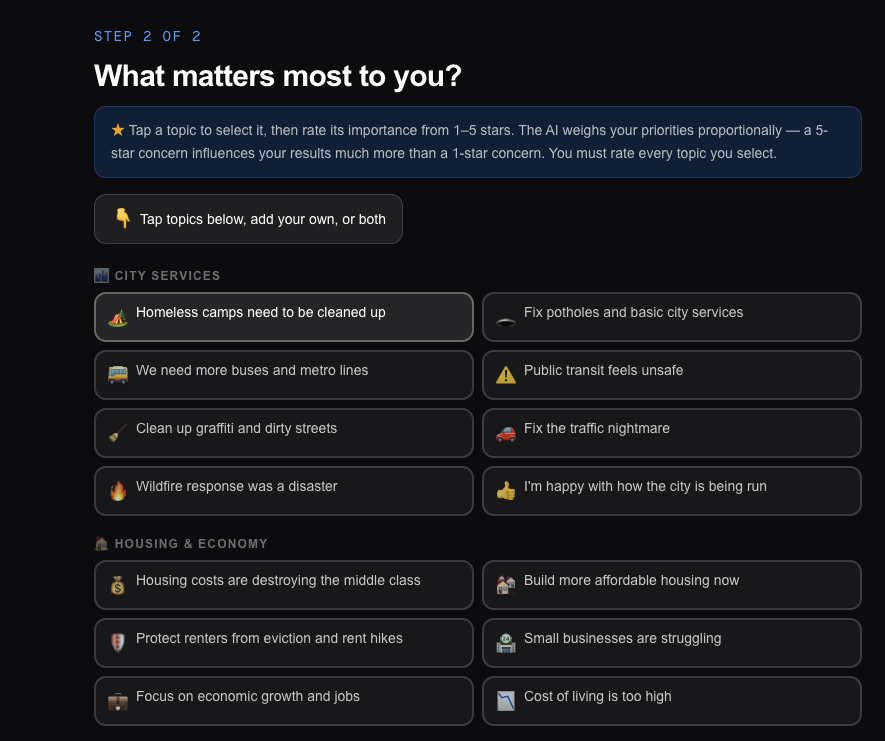
Selecting Concerns — 42 Issues, 7 Categories
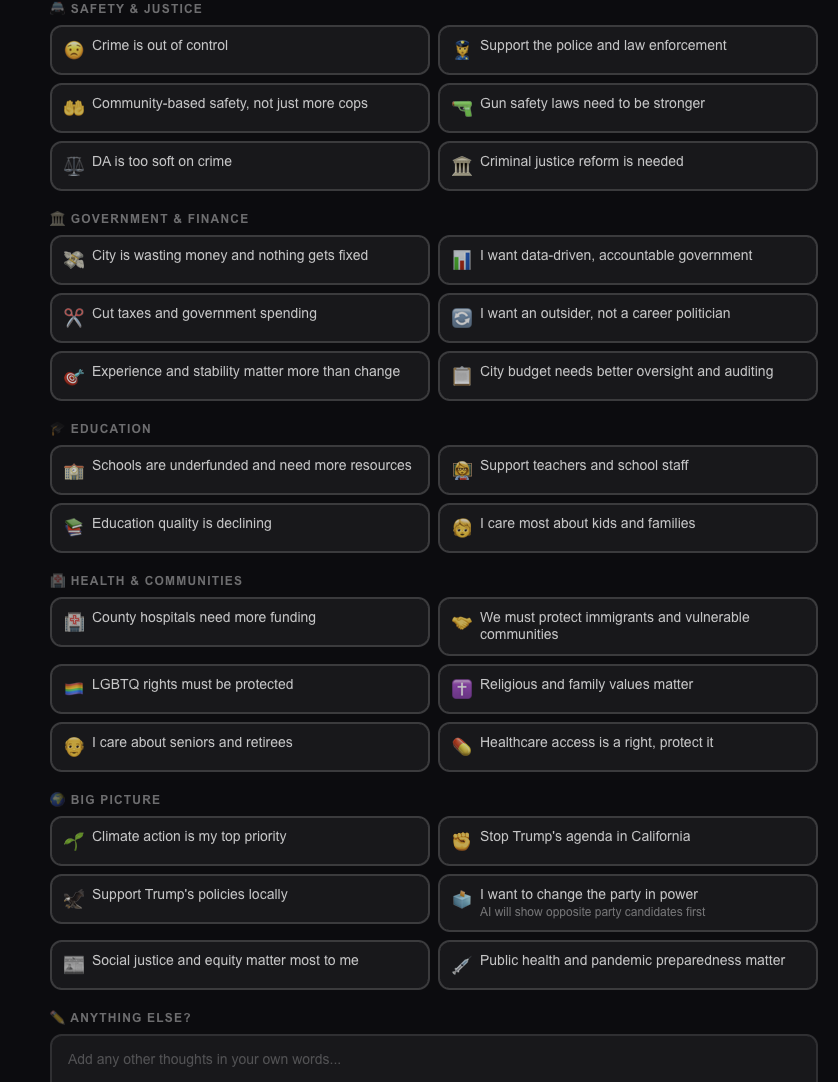
After entering their ZIP, voters see the concerns page. Forty-two issues are organized into seven categories: City Services, Housing & Economy, Safety & Justice, Government & Finance, Education, Health & Communities, and Big Picture. A free-text field at the bottom lets voters add anything not on the list in their own words.
The range is intentionally comprehensive and nonpartisan. The same page includes "Support the police and law enforcement" and "Community-based safety, not just more cops." It includes "Stop Trump's agenda in California" and "Support Trump's policies locally." Every political perspective is represented without editorial judgment.
City Services & Housing & Economy categories
Safety through Big Picture + free-text field
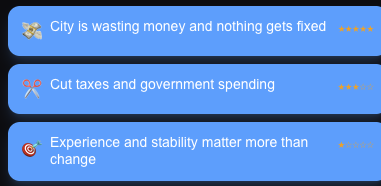
Star Ratings — Weighing What Matters Most
What separates WhoDoIVoteFor from a checklist is the star rating system. Once a voter selects a concern, they rate its importance from 1 to 5 stars. A 5-star concern influences the position comparison far more than a 1-star concern — creating a nuanced civic profile rather than a flat list of topics.
Star ratings on selected concerns. Three concerns shown with different importance weights. The AI compares candidates against this weighted profile — this is the core of the comparison engine. The distinction between what someone cares about and how much they care is what makes the comparison informative.
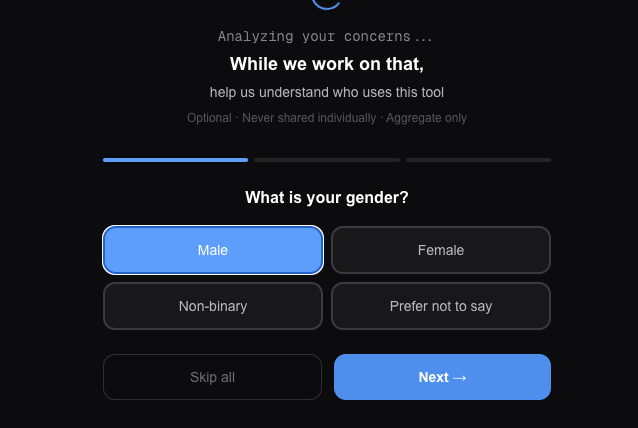
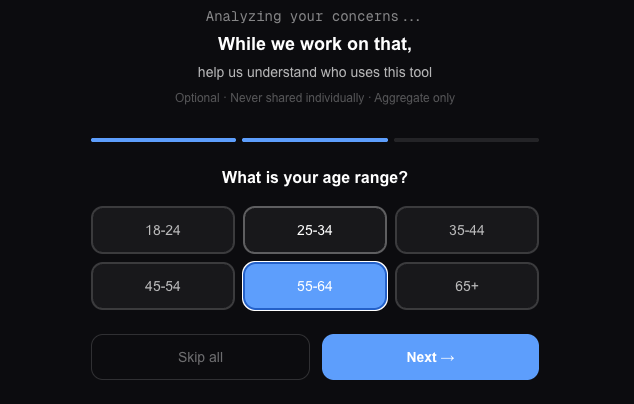
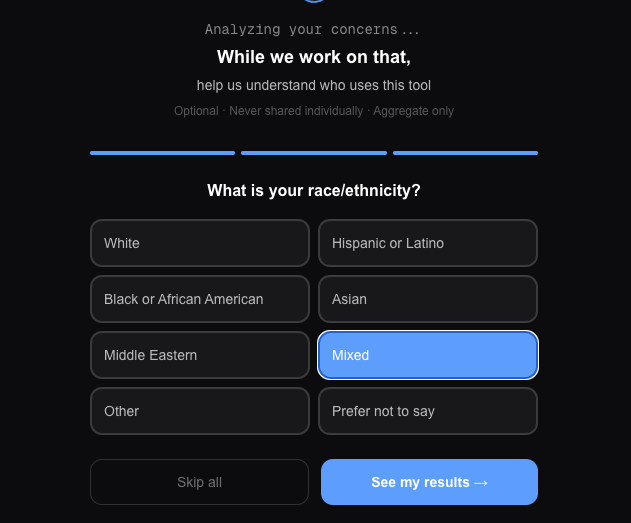
The Demographic Gate — Data While You Wait
After submitting their concerns, the AI begins analyzing in the background. While it works — typically 15-30 seconds — the platform presents three optional questions: gender, age range, and race/ethnicity. "Optional · Never shared individually · Aggregate only" stays visible throughout. "Skip all" is always one tap away. Over 75% of users answer all three questions.
Step 1 of 3 — Gender
Step 2 of 3 — Age Range
Step 3 of 3 — Race/Ethnicity
The Results — Informational, Race by Race
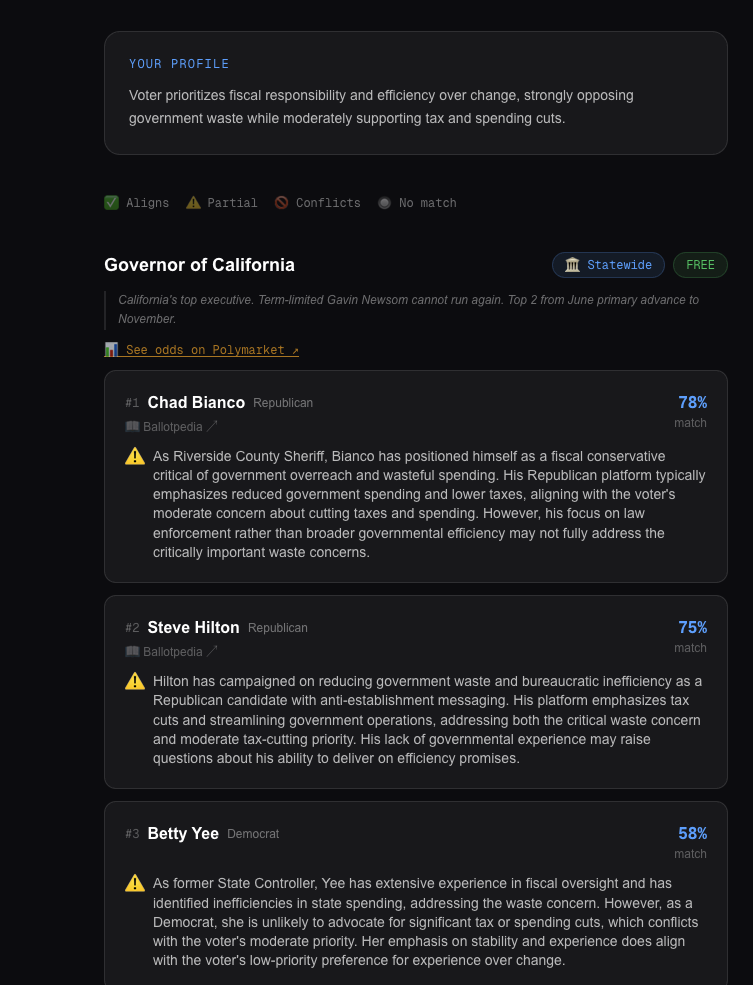
Results appear race by race, starting with the top-of-ticket Governor and Mayor races. Each candidate's publicly available positions are compared against the voter's stated issue priorities, with a 2-3 sentence explanation based on public information. This is informational only — not a voting recommendation or endorsement. Users are encouraged to independently verify all information before making their own voting decisions.
Governor of California — position comparison. Each candidate's publicly stated positions are compared against the voter's issue priorities. The percentage reflects position overlap based on publicly available information. A live Polymarket odds link gives real-time prediction market data for context.
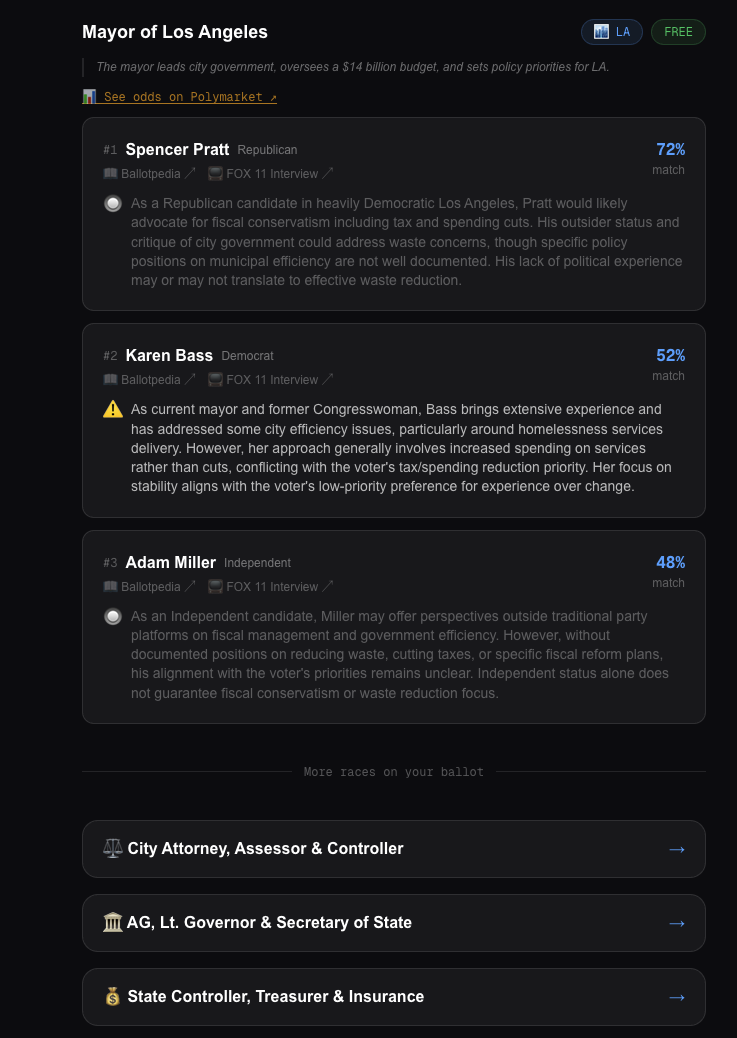
Mayor of Los Angeles and additional races. Each candidate's public positions are summarized based on interviews, statements, and public records. Below the Mayor race, five additional race categories collapse into expandable sections — covering the full ballot while keeping the page clean. Ballotpedia and FOX 11 Interview links appear for each candidate for independent verification.
Part Two: The Civic Data Platform
📊 For Journalists & Media Organizations
Every completed quiz feeds a password-protected admin dashboard that transforms individual responses into structured civic data. The dashboard has six tabs, each answering a different analytical question — from "what does the whole city care about?" to "what does a specific demographic in a specific ZIP code care about a specific issue?"
All data is aggregate. No individual profiles are exposed. This civic data is useful for journalists writing place-based election stories and media organizations seeking to understand what their communities actually care about.
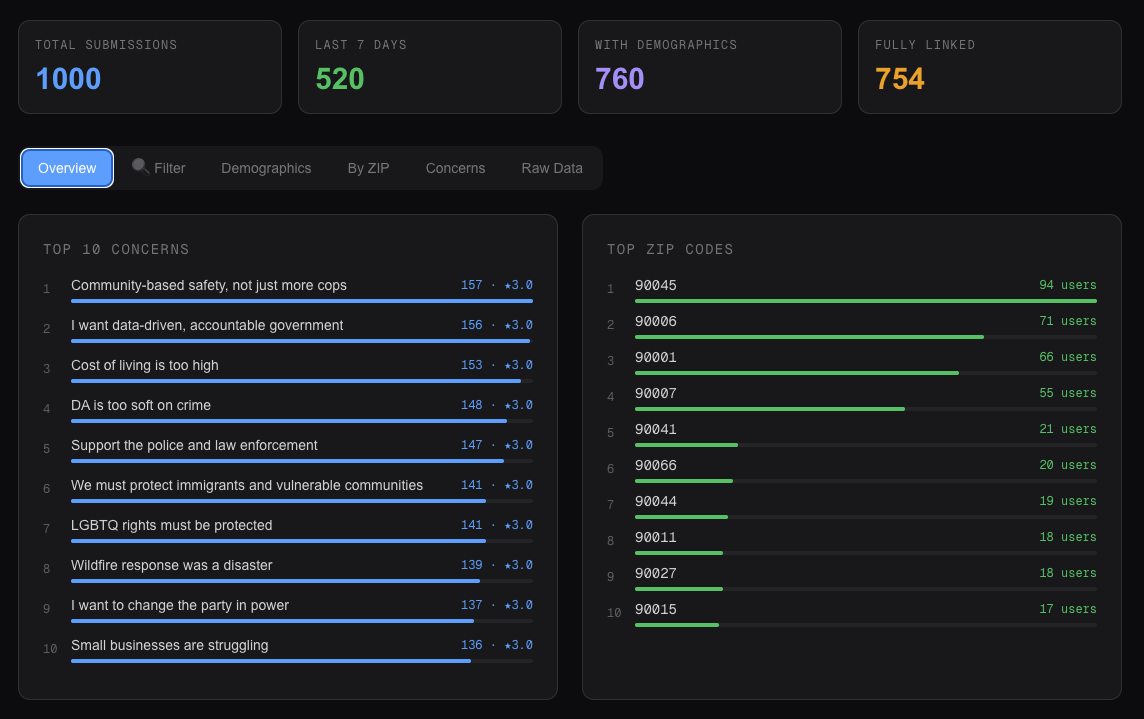
Overview — The Citywide Picture
Four metrics sit at the top of every tab: total submissions, activity in the last 7 days, how many users answered demographics, and how many are "fully linked" — meaning their submission and demographics are connected via session ID and can be cross-analyzed. The Overview tab shows the top 10 concerns and top 10 ZIP codes side by side.
Overview tab. 1,000 total submissions, 512 in the last 7 days, 760 with demographics answered, 754 fully linked for cross-analysis. Top concern: "Community-based safety, not just more cops" at 157 users (16%). Top ZIP: 90045 with 94 users.
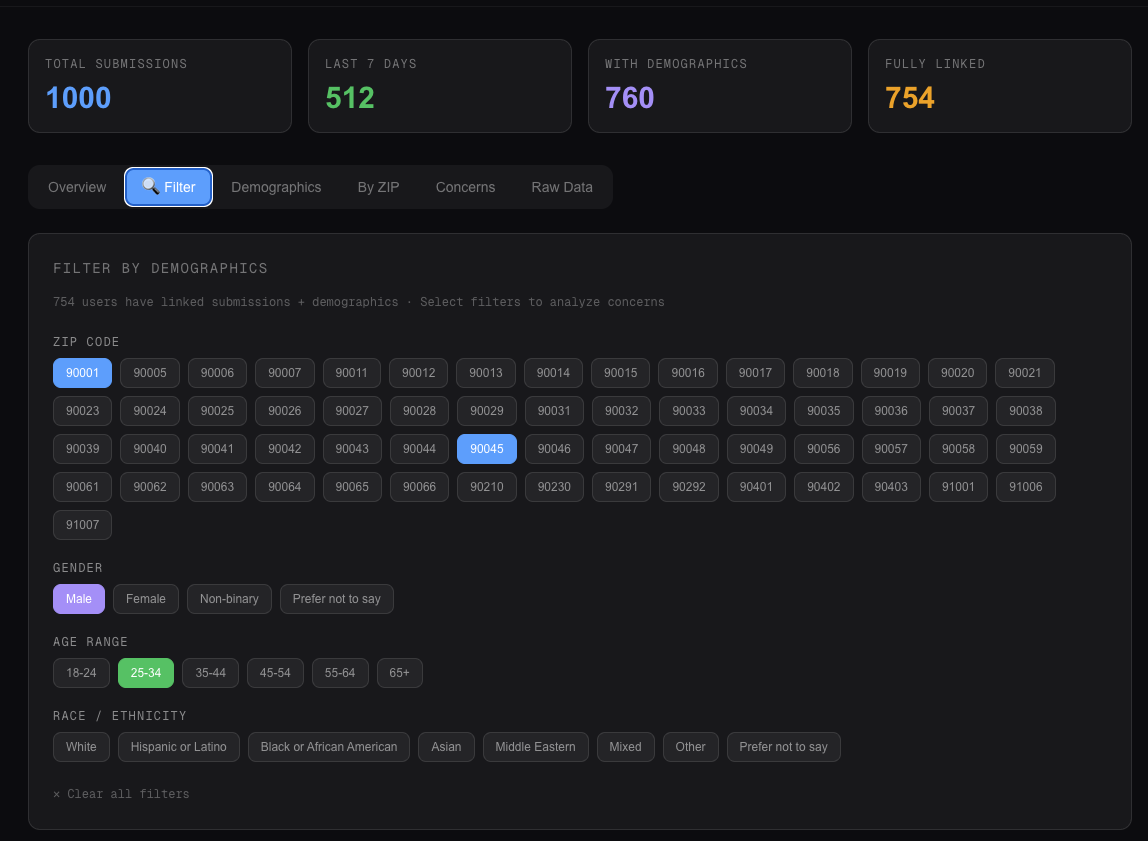
Filter Tab — Cross-Dimensional Analysis
Select any combination of ZIP codes, genders, age ranges, and race/ethnicity options — the ranked concern list below updates instantly. No SQL, no data exports, no analyst required.
Select ZIP + demographics to filter
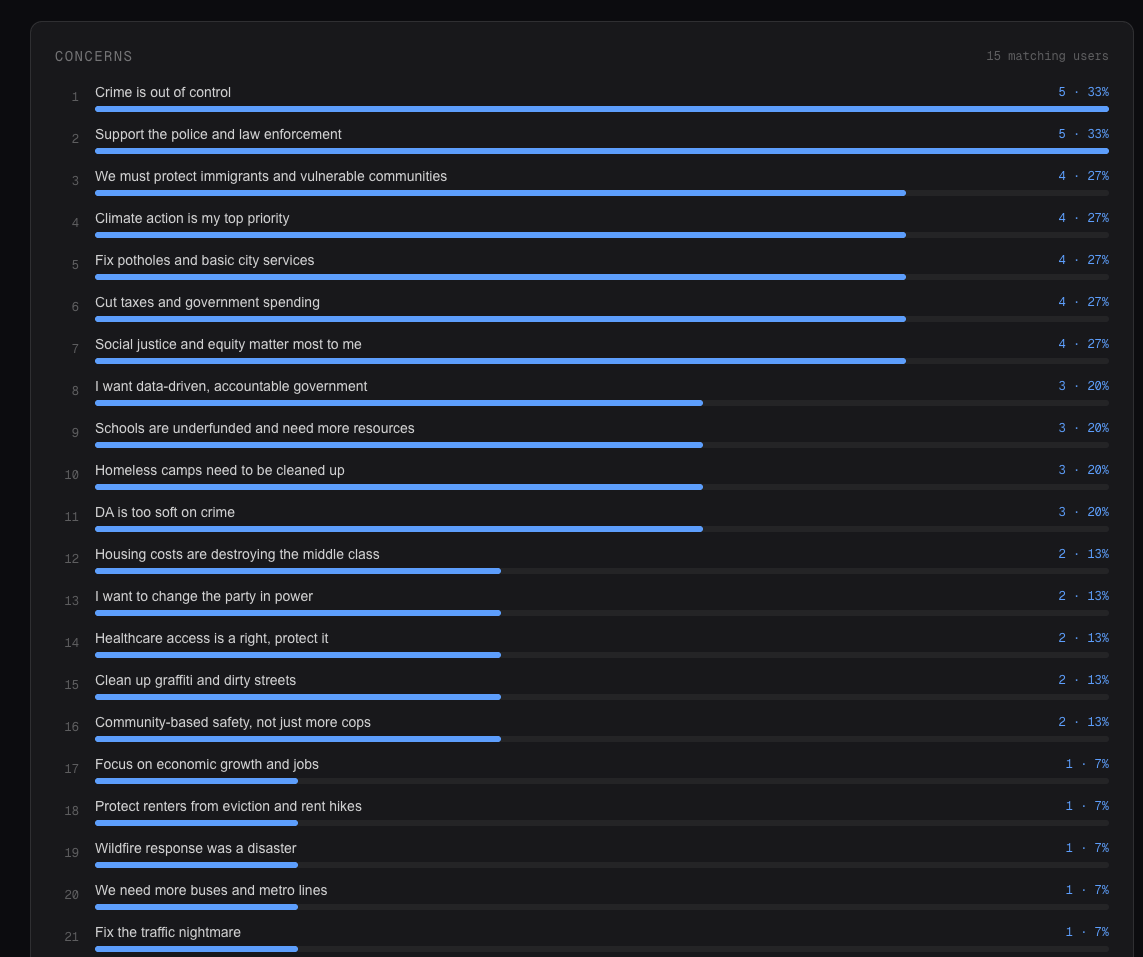
Ranked concerns for selected demographic
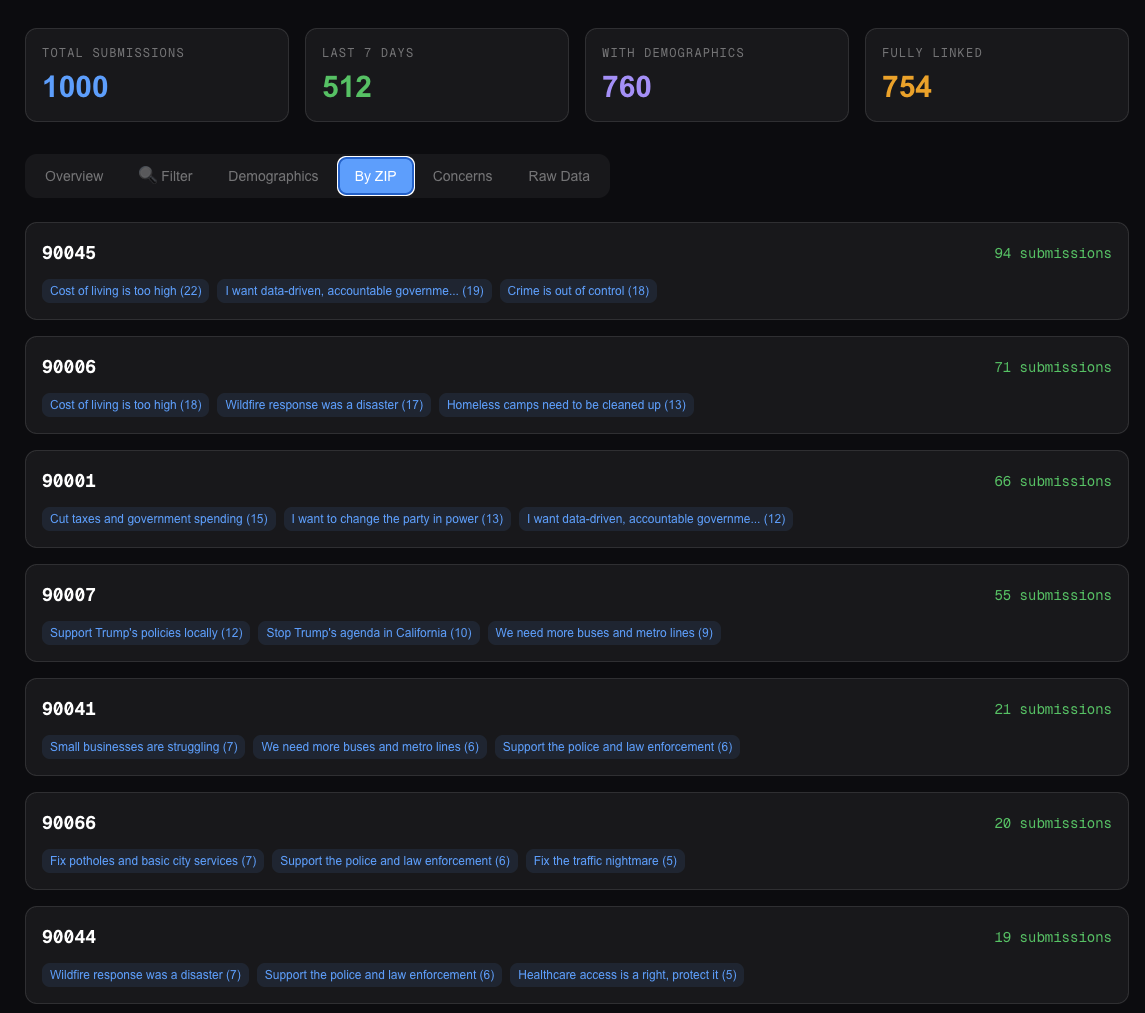
By ZIP — Neighborhood-Level Civic Data
The By ZIP tab shows each ZIP code's top three concerns — no aggregation across the city. Pure geographic specificity at the neighborhood level. This is what journalists use to write place-based, community-accurate civic stories.
By ZIP tab. ZIP 90045: Cost of living, accountable government, crime. ZIP 90006: Cost of living, wildfire response, homelessness. ZIP 90007: "Support Trump's policies locally" AND "Stop Trump's agenda in California" both appear — a politically divided neighborhood. Each ZIP has a distinct civic concern profile.
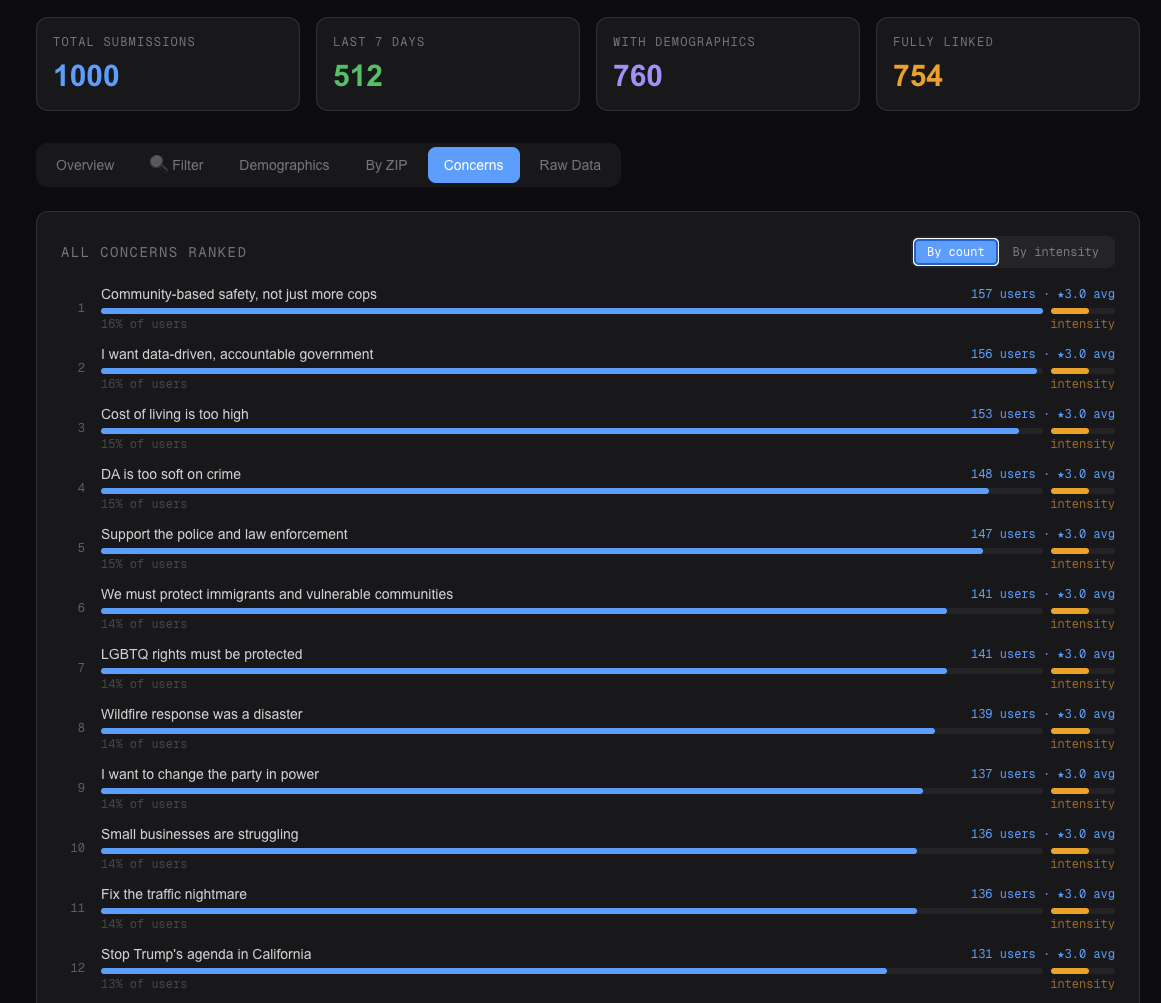
Concerns Tab — Volume and Intensity, Side by Side
The Concerns tab ranks all issues with two metrics: volume (how many users selected it) and intensity (average star rating). A toggle switches between sorting by count and sorting by intensity — surfacing what people feel most strongly about even when it's not the most commonly mentioned.
All Concerns Ranked. Blue bar = volume, gold bar = intensity. "Community-based safety, not just more cops" leads at 157 users (16%). The sort toggle switches between breadth (count) and depth (intensity) — both signals matter for understanding a community's priorities.
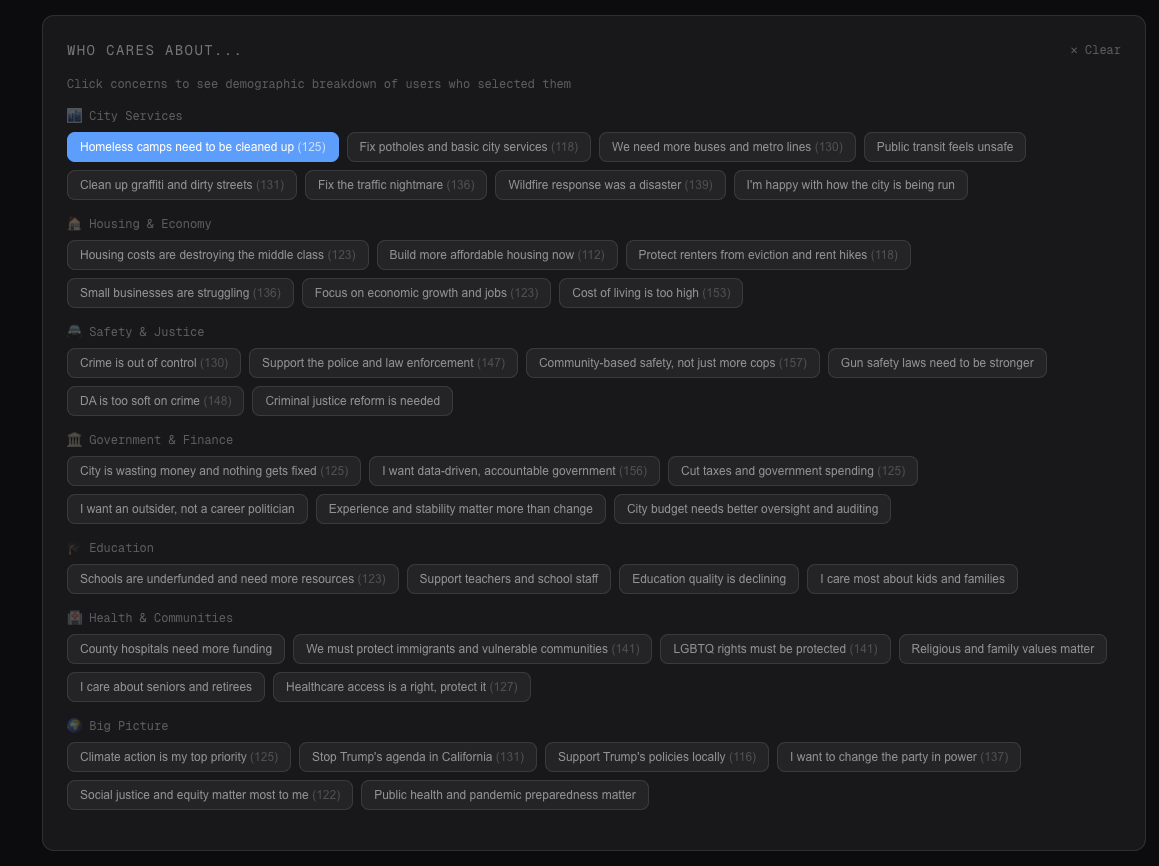
"Who Cares About..." — The Reverse Query
Instead of "what does demographic X care about?", this asks "who cares about concern Y?" Click any concern chip to trigger a demographic breakdown of everyone who selected it.
"Who Cares About..." concern selector. All 42 concerns organized into 7 categories. "Homeless camps need to be cleaned up" (125 users) is selected in blue. The reverse query answers questions no traditional poll can: "Who specifically identified homelessness as a concern, and what do we know about them demographically?"
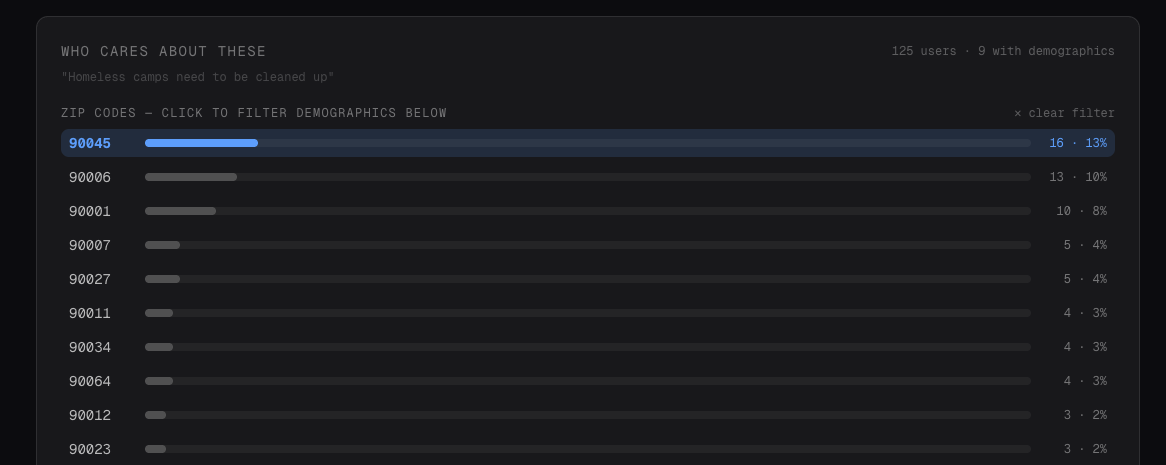
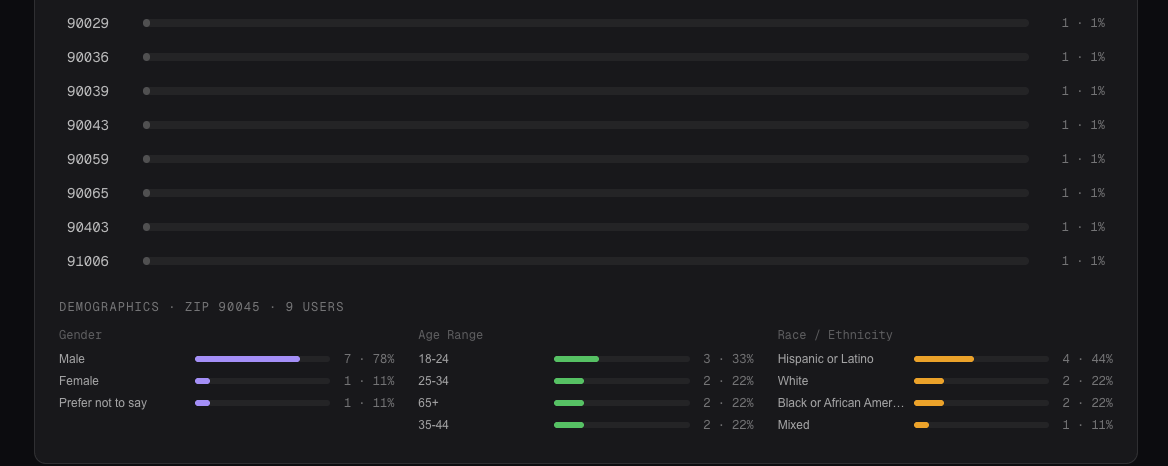
Drilling Down — Concern + ZIP = Community Profile
When a concern is selected, ZIP code rows appear. Clicking any ZIP filters the demographic breakdown to show only users from that ZIP who selected that concern — community-level data useful for journalists writing accurate, representative local stories.
Click a ZIP to filter demographics below
Demographic profile for concern in that ZIP
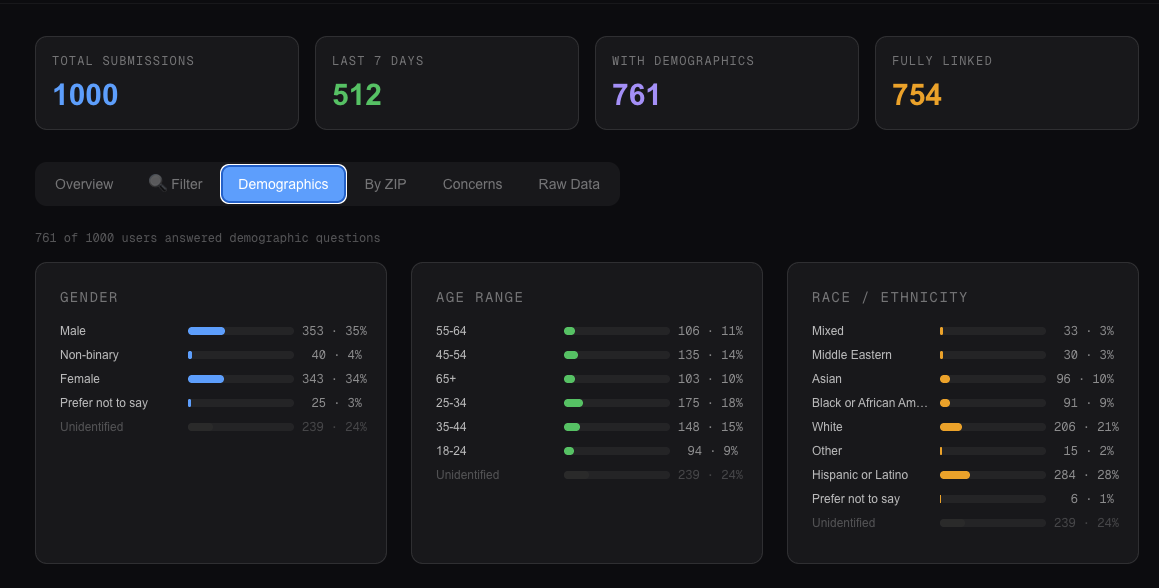
Demographics Tab — The City-Wide Profile
The Demographics tab shows the overall composition of WhoDoIVoteFor users — who is engaging with the platform, broken down by gender, age range, and race/ethnicity. The "Unidentified" row is always shown in grey — an honest accounting of users who skipped the demographic questions.
Demographics tab. 760 of 1,000 users answered demographic questions. Gender: 35% Male, 34% Female, 4% Non-binary, 24% Unidentified. Age: 25-34 leads at 18%. Race: Hispanic or Latino at 28%, White at 21%, Asian 10%, Black or African American 9%.
Why This Matters for Media and Civic Organizations
Traditional political polling costs $50-150 per respondent, takes weeks to field and analyze, and asks the questions the pollster chose to ask. WhoDoIVoteFor inverts all three constraints simultaneously.
Traditional Polling
$50–150 per respondent
Pollster chooses the questions
Static snapshot, weeks to field
Sample size 500–1,000
No behavioral signal
Geographic limits by design
Demographics collected separately
No intensity measurement
WhoDoIVoteFor
Near-zero marginal cost per user
Voters choose their own concerns
Live data, updates continuously
Scales to tens of thousands
Active civic engagement signal
ZIP-level geographic precision
Demographics linked to concerns
Star ratings measure intensity
For a media organization with an existing audience, promoting WhoDoIVoteFor transforms passive readers into active civic data contributors. A publication with 10 million monthly readers could see 50,000-200,000 completions — a community dataset that would cost $5-30 million to collect through traditional polling.
The editorial applications are immediate. Instead of publishing generic polling stories, a media partner can publish stories built directly from their own audience's data:
"What Westside voters care about vs. South LA — mapped by concern intensity"
"Why housing is a top crisis for renters under 35 but a lower priority for homeowners over 55"
"The wildfire effect: how concern priorities shifted in ZIP codes hit by the January fires"
"The issues where LA neighborhoods agree — and where they don't"
What's Next
WhoDoIVoteFor launched for the June 2, 2026 California Primary covering Los Angeles. After June 2, the platform expands to the November 3, 2026 midterms — 35 Senate races, 435 House seats, and 36 Governor races across all 50 states. The same ZIP → concerns → AI comparison flow, applied to every electorate in the country.
If you're a media organization, journalist, or civic technology company interested in what this platform can do with your audience, reach out at vote@whodoidvotefor.com.
Important Disclaimers
WhoDoIVoteFor is an independent, nonpartisan civic information platform created for educational and informational purposes only. We do not endorse political candidates, political parties, campaigns, or political organizations of any kind.
We are not affiliated with, coordinated with, funded by, or acting on behalf of any political campaign, political action committee (PAC), political party, candidate committee, lobbying organization, or government entity.
Information is compiled from publicly available sources including candidate websites, public statements, interviews, and news reporting. While we strive for accuracy and fairness, users are encouraged to independently verify all information and make their own voting decisions.
We do not provide political consulting services, campaign services, fundraising services, advertising services, or voter targeting services. We do not accept political donations or compensation from political campaigns or political organizations.
Explore Candidate Positions — Free
Enter your ZIP code, select the issues that matter to you, and see where candidates stand — based on publicly available information.